- Mar 1, 2013
- 2
- 0
- 0
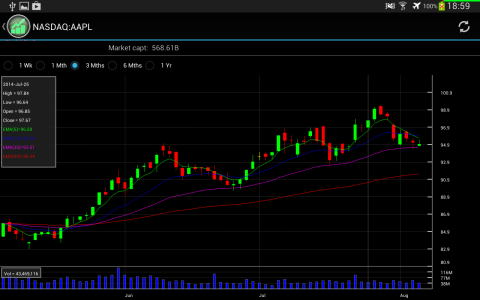
Candle Stick Charts are now easy. "Stock Chart" helps you to
- View Stock prices in Candle Stick Chart format
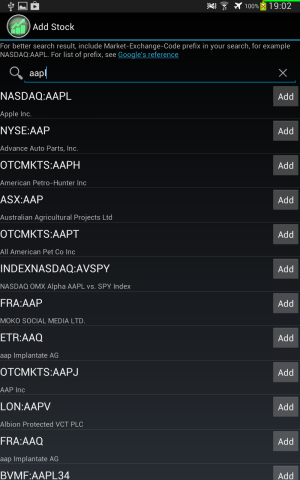
- Works with stocks from major markets
- No any logon/registration required
- EMA (Exponential Moving Average) lines (Configurable)
- RSI indicator
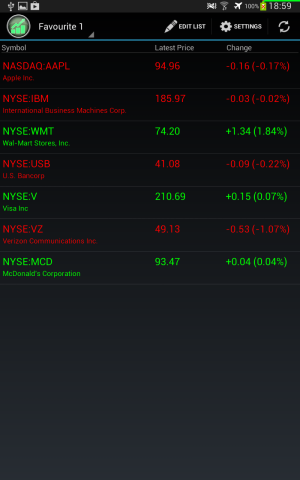
- Up to 5 favorite stock watch lists
Before you buy/sell stocks in your portfolio, check this app to see whether the stocks are in up or down trend.
Download at https://forums.androidcentral.com/e...s?id=com.aimhighlab.stockchart&token=V2CnqRIR


Last edited:

