- Jun 7, 2015
- 511
- 0
- 0
I know this should hopefully be easy. But I'm still not really figuring out what's going on.
My phone sometimes runs warm. And at the moment, despite rebooting 20 minutes ago, CPU-Z is showing that 4 cores are often running at 1.4 GHz, and sometimes the last 2 are jumping up to 1.8 GHz. Over the weekend I think they would often all sit at 384 MHz. Running faster will obviously drain the battery faster, and produce more heat.
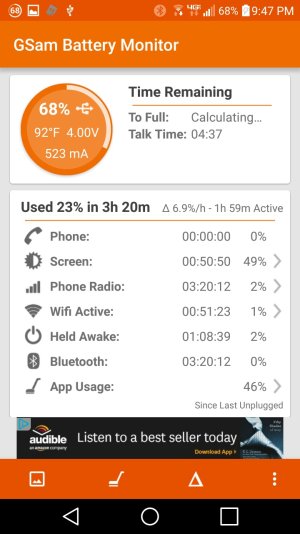
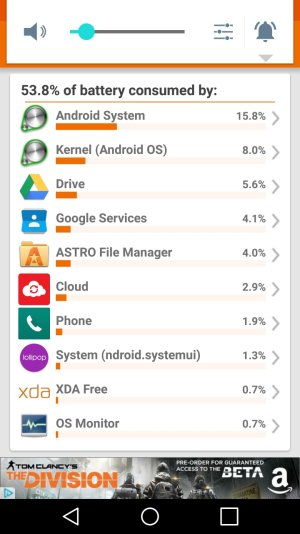
But I can't figure out what's causing it. The built-in Battery tool doesn't show anything obvious. I have Zapper Task Killer, hoping it would show a "smoking gun" app with high CPU usage, but no. Watchdog Lite and OS Monitor (installed yesterday) also aren't really helping. I have Greenify, but haven't yet tried to figure out how to really put it to use. The only standalone apps that show high battery-use in the Battery tool are the ones you'd expect, like the navigation app, etc.
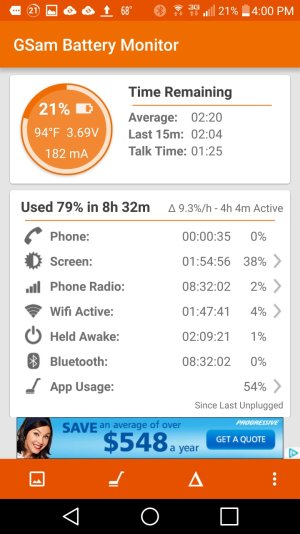
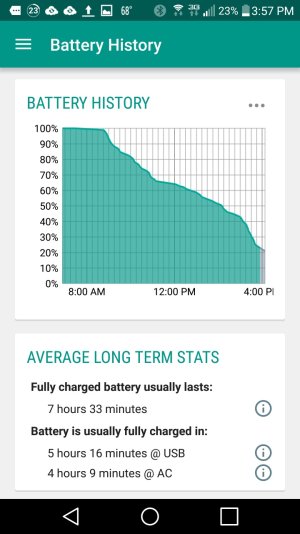
The phone has 4 and a half hours of use on the battery today, 1 hour 50 minutes of SOT, and is at 40%, for reference. If I kept up this usage pattern, it would be dead by about 1PM.
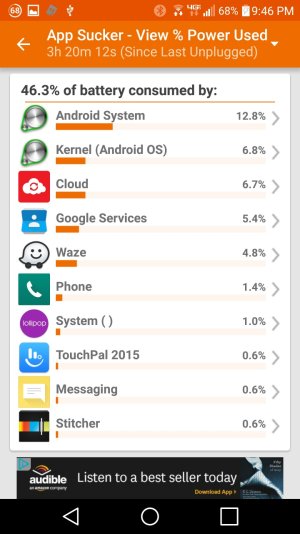
I noticed that Swiftkey would sometimes show ~5% CPU usage in OS Monitor, but I'm not even *using* Swiftkey at the moment, so I just uninstalled it. The Verizon Cloud app was also showing ~8% usage for a while, when it shouldn't be doing anything (WiFi is off, and it's only supposed to sync over WiFi).
I do realize it's possible that the monitoring-apps themselves are becoming part of the problem, rather than the solution. Try to monitor with 50 apps, and you'll kill the battery by simply trying to figure out what's going on. Maybe I should start by removing some of the monitoring apps I've added.
Am I using the wrong tools? Or just missing something obvious? Part of what I'd like to see is something like my S3 showed, a battery graph that also shows an "Awake" line, which at least helped reveal when something was unexpectedly keeping the phone active. I have not yet found a way to show that on my G4. Maybe that went away with Lollipop, or maybe that nice graph was a Samsung thing.
I just checked CPU-Z again, now it's calmed down somewhat, and all 6 cores sometimes actually show 384MHz. Then the first 4 will jump up to 1.2GHz, 0.9GHz, etc, then drop again.
Any input is appreciated. I apologize if this is a dumb question, but I feel like I'm missing something. I have disable Google syncing for Google products I don't use. Thanks.
My phone sometimes runs warm. And at the moment, despite rebooting 20 minutes ago, CPU-Z is showing that 4 cores are often running at 1.4 GHz, and sometimes the last 2 are jumping up to 1.8 GHz. Over the weekend I think they would often all sit at 384 MHz. Running faster will obviously drain the battery faster, and produce more heat.
But I can't figure out what's causing it. The built-in Battery tool doesn't show anything obvious. I have Zapper Task Killer, hoping it would show a "smoking gun" app with high CPU usage, but no. Watchdog Lite and OS Monitor (installed yesterday) also aren't really helping. I have Greenify, but haven't yet tried to figure out how to really put it to use. The only standalone apps that show high battery-use in the Battery tool are the ones you'd expect, like the navigation app, etc.
The phone has 4 and a half hours of use on the battery today, 1 hour 50 minutes of SOT, and is at 40%, for reference. If I kept up this usage pattern, it would be dead by about 1PM.
I noticed that Swiftkey would sometimes show ~5% CPU usage in OS Monitor, but I'm not even *using* Swiftkey at the moment, so I just uninstalled it. The Verizon Cloud app was also showing ~8% usage for a while, when it shouldn't be doing anything (WiFi is off, and it's only supposed to sync over WiFi).
I do realize it's possible that the monitoring-apps themselves are becoming part of the problem, rather than the solution. Try to monitor with 50 apps, and you'll kill the battery by simply trying to figure out what's going on. Maybe I should start by removing some of the monitoring apps I've added.
Am I using the wrong tools? Or just missing something obvious? Part of what I'd like to see is something like my S3 showed, a battery graph that also shows an "Awake" line, which at least helped reveal when something was unexpectedly keeping the phone active. I have not yet found a way to show that on my G4. Maybe that went away with Lollipop, or maybe that nice graph was a Samsung thing.
I just checked CPU-Z again, now it's calmed down somewhat, and all 6 cores sometimes actually show 384MHz. Then the first 4 will jump up to 1.2GHz, 0.9GHz, etc, then drop again.
Any input is appreciated. I apologize if this is a dumb question, but I feel like I'm missing something. I have disable Google syncing for Google products I don't use. Thanks.
 Twitter