- Dec 4, 2012
- 35,617
- 590
- 113
In order to further understand any battery drains, how to read the battery reports on Android is vital.
I am going to cover the basic Android battery stats.
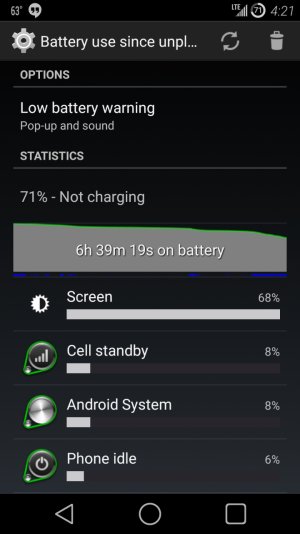
When you click on Settings>Battery, you are first met with a remaining percentage at the top, a line graph immediately below, time spent unplugged, and a series of bar graphs to indicate the usage of each app.

In the above screen shot, you can see that my screen is showing a value of 68%. That does NOT mean that my screen is using 68% of my battery, but 68% of the drained amount. In actuality, it means that about 20% of the 29% drained is due to my screen (Showing the math: 0.68 x 0.29 = .1972). The screen is usually the biggest battery killer of anything on a phone.
[TIP]Almost any section of these reports is clickable. The graph at the top, each app line can reveal more info. [NOTE]Often other users will ask for screenshots. They are most likely asking for the two shown here, plus clicking the screen entry to show screen on time.[/NOTE] [/TIP]
Upon clicking on the graph picture, you can see this:

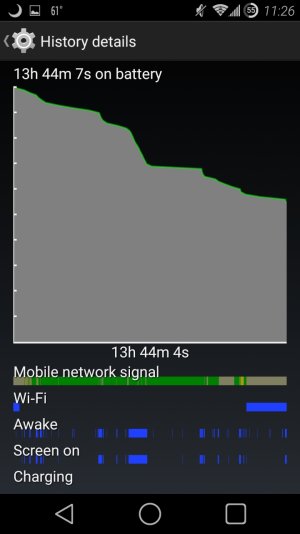
This illustrates the battery drain on a scale. The bars are labeled for Mobile network, WiFi, when the device is Awake, Screen on, and Charging. The device being awake is a good line to pay attention to. Unless you can easily explain why the line is a solid bar (a good example will be listening to music) there really should be no reason why your device is awake. The other line to compare it to is the Screen on line. Those two bars should reasonably match each other.
For instance, in my screenshot, the large gap that my screen was off (except for that single tiny line) I have about 10 instances where my device was awake. I do have battery saving Location Reporting on and a 1 hour interval on a weather application. So that can explain some of them. Because the waking lasted several seconds, I am obviously not too concerned about them.
As you can see, most of my awake time was mirrored by my screen time.
These next two shots were recorded later the same day:

My battery time has increased to 13 hours and 44 minutes. My screen percentage changed from 68% to 59%. This is a somewhat important point to observe. The OS is always evaluating your current use as adjusting your battery stats to reflect that. That is why sometimes when you look at your stats, and then compare them again later, they will seem different. Say for instance, if I would have played one of my more resource intensive games, it will probably show up as second on the battery stats. The more resource intense the app or game, the faster it will appear on your list.

Another comparison between the two graph photos. The mobile network bar at the bottom: that can clearly indicate how cell signal strength has a direct relationship with your battery life. It is hard to apply in this case, as my cell strength was a little weak as my screen was on, in correspondence to the declines in the battery.
However, if the bar is red (indicating a bad signal) and the battery plummets, that shows that the phone is killing itself to try to maintain the signal.
[INFO]Overall, if you have a solid blue bar under Awake, and the screen wasn't on during that time, there is an issue. These reports can help you determine if you have a wake lock on your device. Now, while it may not always tell you which app, at least there is an indicator of something is going on. If it does tell you what app is chewing up your battery it will most likely be labeled as Media.[/INFO]
I am going to cover the basic Android battery stats.
When you click on Settings>Battery, you are first met with a remaining percentage at the top, a line graph immediately below, time spent unplugged, and a series of bar graphs to indicate the usage of each app.

In the above screen shot, you can see that my screen is showing a value of 68%. That does NOT mean that my screen is using 68% of my battery, but 68% of the drained amount. In actuality, it means that about 20% of the 29% drained is due to my screen (Showing the math: 0.68 x 0.29 = .1972). The screen is usually the biggest battery killer of anything on a phone.
[TIP]Almost any section of these reports is clickable. The graph at the top, each app line can reveal more info. [NOTE]Often other users will ask for screenshots. They are most likely asking for the two shown here, plus clicking the screen entry to show screen on time.[/NOTE] [/TIP]
Upon clicking on the graph picture, you can see this:

This illustrates the battery drain on a scale. The bars are labeled for Mobile network, WiFi, when the device is Awake, Screen on, and Charging. The device being awake is a good line to pay attention to. Unless you can easily explain why the line is a solid bar (a good example will be listening to music) there really should be no reason why your device is awake. The other line to compare it to is the Screen on line. Those two bars should reasonably match each other.
For instance, in my screenshot, the large gap that my screen was off (except for that single tiny line) I have about 10 instances where my device was awake. I do have battery saving Location Reporting on and a 1 hour interval on a weather application. So that can explain some of them. Because the waking lasted several seconds, I am obviously not too concerned about them.
As you can see, most of my awake time was mirrored by my screen time.
These next two shots were recorded later the same day:

My battery time has increased to 13 hours and 44 minutes. My screen percentage changed from 68% to 59%. This is a somewhat important point to observe. The OS is always evaluating your current use as adjusting your battery stats to reflect that. That is why sometimes when you look at your stats, and then compare them again later, they will seem different. Say for instance, if I would have played one of my more resource intensive games, it will probably show up as second on the battery stats. The more resource intense the app or game, the faster it will appear on your list.

Another comparison between the two graph photos. The mobile network bar at the bottom: that can clearly indicate how cell signal strength has a direct relationship with your battery life. It is hard to apply in this case, as my cell strength was a little weak as my screen was on, in correspondence to the declines in the battery.
However, if the bar is red (indicating a bad signal) and the battery plummets, that shows that the phone is killing itself to try to maintain the signal.
[INFO]Overall, if you have a solid blue bar under Awake, and the screen wasn't on during that time, there is an issue. These reports can help you determine if you have a wake lock on your device. Now, while it may not always tell you which app, at least there is an indicator of something is going on. If it does tell you what app is chewing up your battery it will most likely be labeled as Media.[/INFO]
Last edited:

