Google Possibly Investing in Songza

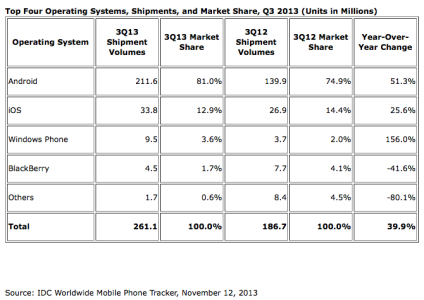
IDC data shows 66% of Android's 81% smartphone share are junk phones selling for $215

IDC data shows 66% of Android's 81% smartphone share are junk phones selling for $215

IDC.Q3smartphones.111213.png

The link says Android has 81% marketshare.

Apple Insider is saying 66% of Android phones are "junk".

That leaves 44% that are not "junk" (as Apple Insider defines it).

That 44% equates to 35.4% world marketshare (I can run the math for you if you'd like).

iOS only has 13% world marketshare (I'm being generous to them in my rounding). Android phones that are not junk outnumber iPhones by almost 3 to 1.

Questions? Comments?

(Who knew Apple Insider would be such a great source for this argument lol)

Are those numbers including tablets because the numbers that I pulled from Q4 2013 are drastically different and show Apple quite a bit higher than that. Not insinuating anything, the numbers said they were from 02/14/14 but reflected Q4 2014. It's just as likely that I'm wrong. Never know with some of these sources.
 
S4-- 50,000,000
S5-- 15,000,000
M8-- 500,000
M7-- 5,000,000
Nexus 4-- 375,000
Nexus 5-- ?
G2-- 3,000,000
G3-- ?
Note 2 and Note 3 combined-- 40,000,000

Total-- 113,875,000-- Earliest release date of any of these phones is 2012.

iPhone since 2012-- 356,000,000


Scared to research these numbers?

BTW, 100 minus 66= 34, not 44. :)
 
Are those numbers including tablets
Apple Insider specifically said phones. The source link also mentions smartphones specifically - Android Pushes Past 80% Market Share While Windows Phone Shipments Leap 156.0% Year Over Year in the Third Quarter, According to IDC - prUS24442013

the numbers that I pulled from Q4 2013 are drastically different and show Apple quite a bit higher than that.
The numbers you have might be coming from Comscore...Comscore only tracks US marketshare. And the US is where Apple is strongest. The 81% figure is worldwide.
 
iPhone since 2012-- 356,000,000

Since we're not going to stop on this sales thing, I'd like to point out an error in the logic and part of why the numbers aren't measuring up.

If you're cancelling flagships that released prior to 2012 from the Android numbers and not including all of the other OEM devices and/or the 2012 devices for anything except the Note 2 and S4 then I'd knock off between 1/6 and 1/3 of the iPhone sales number. The reason for this is that Apple tells us total sales volume per quarter (in this case year) and not by model. The 2012 numbers include devices made in 2010 and 2011 and the 2013 numbers include devices made in 2011. In that vein, to make this an oranges to oranges comparison we'd either need to back those sales out (I was generous and assumed a 60% newest 30% legacy and 10% free phone distribution = 1/6 doesn't count) and we would need to include the Galaxy S, Galaxy Nexus, Galaxy S2 (and all variants), HTC Evo, HTC Thunderbolt, HTC Evo 3D, HTC Evo 4G LTE, HTC One X, HTC One X+, Sony Xperia lines from 2011 forward, all of Moto's devices (in US sales they didn't have a "junk" device, not sure about overseas but they're minimal), all of LG's devices plus all of the higher end models that exist predominately overseas from OEMs like Huawei, Xiaomi, Oppo, etc, etc.

Given that logic the best way to measure it would be to only measure new device sales by OS and then reduce Android's by the "junk" factor. Jeff's logic works in this example and could be applied to each quarter in the evaluation period (2012-now). We'd simply sum the total activations numbers for the 30 months or 10 quarters, apply the market share and multiply by the percentage that is "not junk".

If we give Apple Insider the benefit if the doubt, then 34% are "not junk" and therefore 34% of 81% = 27.54% and that is slightly over 2:1 (about 19/9) of Apple's ratio, for the quarter shown.

Either way, the list of devices that were sold in 2012 through 2014 is much longer than 10 devices. Those aren't even the top 10.
 
BTW, 100 minus 66= 34, not 44. :)
Yes, my mistake. That would make world marketshare of "non-junk" Android phones 27.5%.

So instead of "non-junk" Android phones outselling all iPhones by a 3 to 1 margin, they are merely outselling all iPhones but more than 2 to 1. Thanks for clearing that up.

Scared to research these numbers?
The Apple Insider link makes the rest of the argument moot. So there is no point in researching them anymore. "Non-junk" Android phones outsell all iPhones combined by a wide margin, according to Apple Insider.
 
Microsoft then, going to be interesting, THE software giant with quite likely the best OEM in terms of sheer quality together under Satya Nadella... Amazing things will be happening.
Extremely subjective

I'd generally rather have poor apps than a whole OS crashing. There's no denying that that was bad but for every major downturn Apple has had I can find dozens for Google and Android.
Let's see them. I want a dozen "major" occurrences, proven, confirmed by Google and Android for every one we can find for Apple and iOS.

This is true, Jeff is very meticulous at providing legitimate backup unlike some here. That was an unfair accusation.

Well Windows does have the BSOD
Thank you. Nokia and WP have both enjoyed their fair share of tech support problems.
 
Since we're not going to stop on this sales thing, I'd like to point out an error in the logic and part of why the numbers aren't measuring up.

If you're cancelling flagships that released prior to 2012 from the Android numbers and not including all of the other OEM devices and/or the 2012 devices for anything except the Note 2 and S4 then I'd knock off between 1/6 and 1/3 of the iPhone sales number. The reason for this is that Apple tells us total sales volume per quarter (in this case year) and not by model. The 2012 numbers include devices made in 2010 and 2011 and the 2013 numbers include devices made in 2011. In that vein, to make this an oranges to oranges comparison we'd either need to back those sales out (I was generous and assumed a 60% newest 30% legacy and 10% free phone distribution = 1/6 doesn't count) and we would need to include the Galaxy S, Galaxy Nexus, Galaxy S2 (and all variants), HTC Evo, HTC Thunderbolt, HTC Evo 3D, HTC Evo 4G LTE, HTC One X, HTC One X+, Sony Xperia lines from 2011 forward, all of Moto's devices (in US sales they didn't have a "junk" device, not sure about overseas but they're minimal), all of LG's devices plus all of the higher end models that exist predominately overseas from OEMs like Huawei, Xiaomi, Oppo, etc, etc.

Given that logic the best way to measure it would be to only measure new device sales by OS and then reduce Android's by the "junk" factor. Jeff's logic works in this example and could be applied to each quarter in the evaluation period (2012-now). We'd simply sum the total activations numbers for the 30 months or 10 quarters, apply the market share and multiply by the percentage that is "not junk".

If we give Apple Insider the benefit if the doubt, then 34% are "not junk" and therefore 34% of 81% = 27.54% and that is slightly over 2:1 (about 19/9) of Apple's ratio, for the quarter shown.

Either way, the list of devices that were sold in 2012 through 2014 is much longer than 10 devices. Those aren't even the top 10.

Okay, let's go the whole period, so we don't leave any out. There have been over 500,000,000 iPhones sold to date, and close to a billion Androids. Do you actually believe that over half of those sales were high-end Androids? I wouldn't think so.
 
What topped them?

Well one big one missing would be the Galaxy S3 which released in 2012 and thus should be counted and sold at least 50 million. Samsung was also selling S2's and its variants, which adds the better part of 40 million. Between the One X, Evo, DNA, etc HTC has at least another 10 mill to add on to that prior to their 2013 flagship. Right there we have 80-100 million that are inexplicably not counted in the 2012-14 comparison. We still haven't included LG, Moto, etc. While they're not going to be astronomical additions to the count, there is also one other big point: You have 2012-14 with 2 devices that released Q4 of 2012 while comparing it to the entire years sales of all iOS phones, regardless of their release years. As intimated earlier with a modification for the realization that you're counting 30 months for iOS and 20 for Android (prior to limiting device selection), if we want to compare apples to apples, then we're talking either 2013-2014 sales of the android devices you included versus 66-83% of the iphones listed minus all sales that took place in 2012 or we're talking about all sales of both OS from 2012 forward less the percent that are "junk".
 
Okay, let's go the whole period, so we don't leave any out. There have been over 500,000,000 iPhones sold to date, and close to a billion Androids. Do you actually believe that over half of those sales were high-end Androids? I wouldn't think so.

I have no reason to argue against Apple Insider's 44% number. I don't know what the criteria is, but assuming that is true then my earliest statement here:

Here, let me provide the actual values here:

Apple: A lot. No one (including probably Apple) actually knows, especially by model.
Samsung: A lot. Probably less than Apple. No one (including probably Samsung) actually knows.
HTC, LG, Moto, Sony, etc: A lot - and a lot less than Samsung.

Categories 2 & 3, when examining only their "flagship" offerings, might be close to the value of category 1.


Seems to still come out to where we're agreeing. Android sold a heck of a lot, not counting their "junk phones" it's probably the same ballpark as iOS phones.
 
Okay, let's go the whole period, so we don't leave any out. There have been over 500,000,000 iPhones sold to date, and close to a billion Androids. Do you actually believe that over half of those sales were high-end Androids?
In 2013 over twice as many people bought non-junk Android phones as bought iPhones. The rest of the statistics do not matter. Because this fact undermines the initial argument. All you can really try to argue now is how much Android is ahead. It's just a matter of scale at this point.

The total number of iOS phones sold since their introduction is greater than Android. The number of new phones being sold is not, and has not been for a while now.
 
Seems to still come out to where we're agreeing. Android sold a heck of a lot, not counting their "junk phones" it's probably the same ballpark as iOS phones.
Apple Insider seems to disagree...they are saying it is not in the same ballpark at all. They are saying Android sold well over twice as much.
 
Yes, my mistake. That would make world marketshare of "non-junk" Android phones 27.5%.

So instead of "non-junk" Android phones outselling all iPhones by a 3 to 1 margin, they are merely outselling all iPhones but more than 2 to 1. Thanks for clearing that up.


The Apple Insider link makes the rest of the argument moot. So there is no point in researching them anymore. "Non-junk" Android phones outsell all iPhones combined by a wide margin, according to Apple Insider.

That still leaves out the 215-549 window as outside of the Nexus devices, the others all exceeded that on release. Not saying you're not right. Just saying I'm pretty sure that the margin is more than a little off.
 
Seems to still come out to where we're agreeing. Android sold a heck of a lot, not counting their "junk phones" it's probably the same ballpark as iOS phones.

Yeah, I can see that. 1,000,000,000 X 44% = 440,000,000. iPhones = 500,000,000.
Close as you said, but iPhone is ahead.
 
Extremely subjective


Let's see them. I want a dozen "major" occurrences, proven, confirmed by Google and Android for every one we can find for Apple and iOS.


This is true, Jeff is very meticulous at providing legitimate backup unlike some here. That was an unfair accusation.


Thank you. Nokia and WP have both enjoyed their fair share of tech support problems.

Implying Google actually communicates when something goes awry. Haha.
 
That still leaves out the 215-549 window as outside of the Nexus devices, the others all exceeded that on release. Not saying you're not right. Just saying I'm pretty sure that the margin is more than a little off.
There are lots of Chinese made phones that are in that price range that have what most people would consider high end specs. The phones in that link are what Apple Insider themselves considers to be non-junk.
 
Yeah, I can see that. 1,000,000,000 X 44% = 440,000,000. iPhones = 500,000,000.
Close as you said, but iPhone is ahead.
That 44% are the "non-junk" phones runnin android. But your 500,000,000 figure includes all iPhones...even the 3G and 3GS. And I think we can agree those now count as "junk.

So how much of that 500,000,000 figure is just the iPhone 4S and above?
 
Apple Insider seems to disagree...they are saying it is not in the same ballpark at all. They are saying Android sold well over twice as much.

Allowing for variances in how these things are categorized, etc. 13% and 27% are pretty close to each other big picture and basically mean that 40% of all devices are "flagships" while 60% are spread between "junk android" and other OS devices. Relative to each other they're starkly different, but I guess where I'm going is that when we compare oranges to oranges the two arguments aren't that far apart. It's just a matter of being clear about what is being looked at. Of course 30 months of sales on 5 generations of devices sells better than 2 generations of select devices in 18-20 months that sell 2:1 at a 2:1 higher rate. There is at least 50% more time and 150% more device generations being considered.

Comparing all of the sales of the iPhone 3gs, iphone 4, iphone 4s, iphone 5, iphone 5s/5c, the newest of which is nearly a year old between January 2012 and June 2014 against the sales of only select devices released between September 2012 and April 2014 on sales between September 2012 and and June 2014 and ignoring the prior generations and other flagships also for sale during the nonstandard months and subsequent equivalent time period is simply not an even comparison.
 
That 44% are the "non-junk" phones runnin android. But your 500,000,000 figure includes all iPhones...even the 3G and 3GS. And I think we can agree those now count as "junk.

So how much of that 500,000,000 figure is just the iPhone 4S and above?

Who's moving goalposts now, lol? 3G and 3GS were not junk. I am counting ALL iPhones against ALL Androids since inception.
 

Trending Posts

Forum statistics

Threads
956,962
Messages
6,970,817
Members
3,163,674
Latest member
GreigCo