Jason Stroud1
Well-known member
Please report back if you find itSame here, just bought it also. I'm disabling just a few items at a time, (maybe just 1 or 2 per day) to see which ones may be the culprit .
Posted via the Android Central App

Please report back if you find itSame here, just bought it also. I'm disabling just a few items at a time, (maybe just 1 or 2 per day) to see which ones may be the culprit .
Posted via the Android Central App
Mine seems to be high too, but I did get around 24 hours of battery time yesterday (8 hours of which was sleep time for me) and 4.5 hours of screen on time, which is fine for me. Went I went to sleep I had 10% remaining, which I can live with, but Android System is showing as > 20%.
") .
.That's not true because I have used my phone for a couple hours straight screen on time and the android system was still higher. And also I've seen people with 15+ total hours and 4 hours screen on with lower android system usage. I've used this phone like I've used all the ones before and never has android system consistently been higher than my screenThere is no set value that the OS should be using. It is relative to the other usage of the device. If you use your screen a lot more, then the OS usage as a % of total will be lower. If you're one who idles a lot and has a lower screen time, then OS will be higher as a % of total. Jason Stroud1's screenshots are perfectly normal because the phone is idling a lot of the time and the screen is barely being used. Mrrikki's screenshot is perfectly normal because the screen is being used over twice as much. Signal strength, type of connection (WiFi, LTE, HSPA, etc), screen on time, GPS activity, wake activity, etc. all have huge impacts on battery life.
That's not true because I have used my phone for a couple hours straight screen on time and the android system was still higher. And also I've seen people with 15+ total hours and 4 hours screen on with lower android system usage. I've used this phone like I've used all the ones before and never has android system consistently been higher than my screen
Go look a mrrikki's screen shots earlier in the thread. Over 12 hours and around 2 and a half hours screen on time and his android system usage is only around 5 %There is no set value that the OS should be using. It is relative to the other usage of the device. If you use your screen a lot more, then the OS usage as a % of total will be lower. If you're one who idles a lot and has a lower screen time, then OS will be higher as a % of total. Jason Stroud1's screenshots are perfectly normal because the phone is idling a lot of the time and the screen is barely being used. Mrrikki's screenshot is perfectly normal because the screen is being used over twice as much. Signal strength, type of connection (WiFi, LTE, HSPA, etc), screen on time, GPS activity, wake activity, etc. all have huge impacts on battery life.
Go look a mrrikki's screen shots earlier in the thread. Over 12 hours and around 2 and a half hours screen on time and his android system usage is only around 5 %
I understand that. But I am very conservative with my battery life as far as keeping battery draining features off and such. I just don't see why other people would have twice the battery life as me. And as far as the 2.5 screen on time from the other post I was using that as an example of the android system percent being low even though most of his time was spent at idle with only 2.5 hours screen on time.I didn't suggest that there is a -1.0000 correlation between screen on time and android system. I suggested that all of the percentages are meaningless when taken alone. The overall usage profile matters, and that includes screen on time, signal strength, scanning settings (which you might want to look at, see if your wifi and/or BT are always scanning), idle, whether or not doze is happening, etc. Given what we can see of your stats (which is only %, the next screen is more important where it shows what was going on while various states of drain were occurring), your stats look perfectly reasonable. We can't pick any two stats and say, "this is higher and this is lower". You have to look at the entire context, which (again from what we can see) looks completely normal.
motivr's screenshot is a good example. 9 hours of what is basically straight idle. Nothing happened, from what we can see, except idling. But only 83% or so (estimated) of the total 33% that's been used (estimated) is accounted for, so there's still about 1/6 of the battery that's been used thus far accounted for somewhere else.
Nobody should compare their battery life to anyone else's. There are too many variables for that to be accurate. Nor is it fair to compare S7 battery life as reported by the phone to any other device besides the S7.
So, to really compare battery you would need to have two of the exact same device and use them in exactly the same way to actually be able to tell if an app or something else is misbehaving.
Fair enough, just not getting the battery life I had expected. Oh wellSignal strength alone makes even very similar usage profiles very hard to compare. I'd agree with you on this. I think we could get two devices to be similar enough to make general comparisons, but definitely not comparisons that would help with troubleshooting.
Fair enough, just not getting the battery life I had expected. Oh well
I had those disabled already, and when I click the graph is does nothing, so I guess they removed that.Does Samsung still have the second screen when you tap on the graph that shows details of the graph? That'd help quite a bit. Also, I know you said that you disable battery draining features, but they moved WiFi and BT scanning to location, so just double checking that you disabled those (unless you need them of course).
I had those disabled already, and when I click the graph is does nothing, so I guess they removed that.
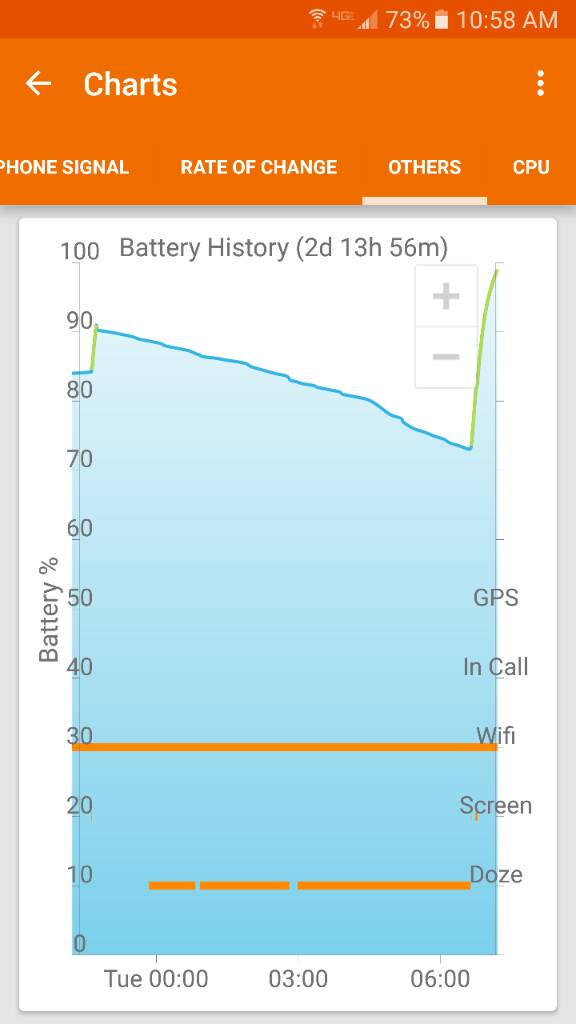
When I'm asleep it usually loses over 15% last night it dropped for 91 to 74 overnight.mumble, grumble. :s That's disappointing.
I suspect that you have a wakelock somewhere, because your WiFi is on 100% of the time on the GSAM shot and the stats show that the device is active for 3 hr 12 minutes out of 5 hr 47 minutes but the screen was only on for 1 hr 12 minutes. So that two hours could perhaps account for streaming pandora with the screen off, but if that's not the case then that's where I'm suspecting a wakelock.
Your stats are trending for 3 hours SOT out of 14 hours total usage compared to another user who is trending for 5 hours of SOT over a 24 hour period - so there's definitely room for improvement, we just can't do an apples to apples and say that 5 hours over 24 hours is the goal, because it might be too aggressive or not aggressive enough.
Here is the chart from last nightmumble, grumble. :s That's disappointing.
I suspect that you have a wakelock somewhere, because your WiFi is on 100% of the time on the GSAM shot and the stats show that the device is active for 3 hr 12 minutes out of 5 hr 47 minutes but the screen was only on for 1 hr 12 minutes. So that two hours could perhaps account for streaming pandora with the screen off, but if that's not the case then that's where I'm suspecting a wakelock.
Your stats are trending for 3 hours SOT out of 14 hours total usage compared to another user who is trending for 5 hours of SOT over a 24 hour period - so there's definitely room for improvement, we just can't do an apples to apples and say that 5 hours over 24 hours is the goal, because it might be too aggressive or not aggressive enough.